For small and medium enterprises (SMEs), every marketing dollar matters. Yet many businesses still rely on gut instinct rather than evidence when it comes to improving their websites. That’s where A/B testing becomes a game-changer: it transforms guesswork into measurable growth.
Drawing on insights from Lean Analytics by Alistair Croll, Dave McClure’s Pirate Metrics (AARRR), and real-world success stories like WineExpress, let’s explore why A/B testing should be at the core of your SME’s digital strategy.
Analytics and Rumsfeld’s “Hidden Genius”
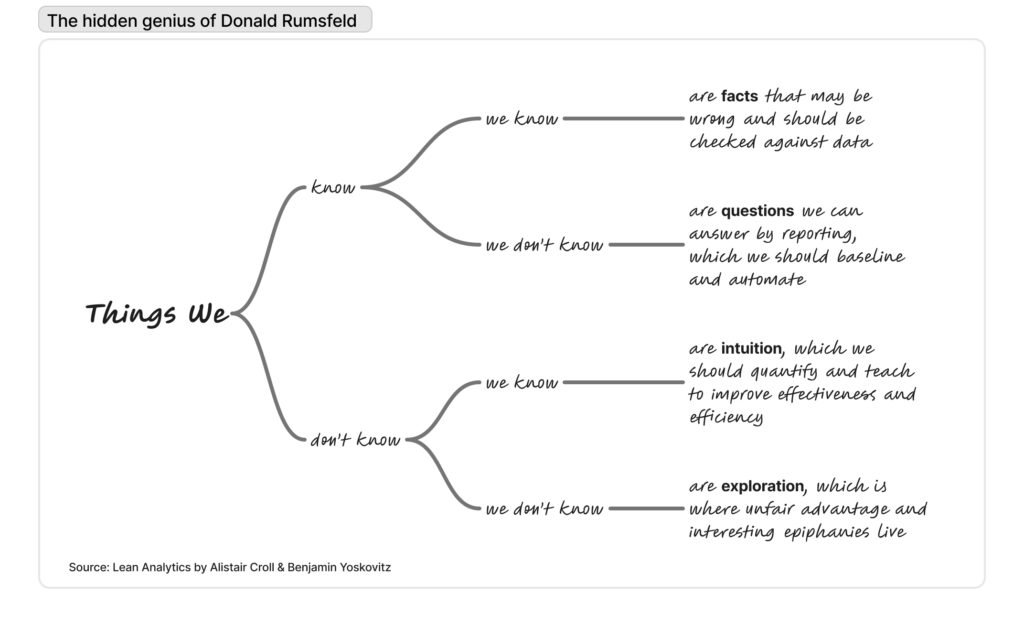
Alistair Croll and Benjamin Yoskovitz, in Lean Analytics, point out that analytics isn’t just about tracking clicks. It has a role in all four of Donald Rumsfeld’s now-famous categories of knowledge:
1.Known knowns – Metrics confirm what you already expect. Example: you know your homepage has traffic, and analytics show the number of visits.
2.Known unknowns – Metrics answer specific questions. We know we don’t know the value of the metric, so we go find out. For instance, we need these metrics to measure the outcome of an experiment (“Did the green or the red widget sell more?”).
3.Unknown knowns –Metrics uncover insights buried in your data, waiting to be uncovered. For instance, WineExpress.com ran an A/B test to optimize its landing page and increase conversions. While the new page improved conversion rates, deeper analysis revealed a 41% increase in revenue per visitor, showing that the changes resonated more with high-value customers. This insight was initially hidden in the data—an example of an “unknown known.” By examining the right metrics beyond simple conversions, WineExpress uncovered a hidden growth opportunity.
4.Unknown unknowns – Metrics help you discover surprises. For example, a leading e-commerce company, aiming to improve its checkout process, initially focused A/B tests on optimizing known factors like button color and form layout. Embracing a lean analytics mindset, they also conducted bold exploratory tests without clear hypotheses. One such test introduced a radically different single-page, minimalist checkout, breaking industry norms of multi-step forms. Unexpectedly, this simplified design boosted conversion rates by 15%, outperforming all other versions.
For SMEs, these insights are vital. They prevent wasted resources and help you double down on what works.
Case Study : WineExpress.com
WineExpress Boosts Revenue by 41% Per Visitor
WineExpress.com, the exclusive online wine shop for the Wine Enthusiast brand, has long leveraged its catalog and website to sell wines, accessories, and storage solutions. To push growth further, the company invested in ongoing A/B testing and experimentation to refine its online sales strategy.
One high-priority experiment centered on the “Wine of the Day” page, a key landing page that highlights a daily featured bottle offered with 99-cent shipping. Visitors typically arrive through email campaigns and site navigation, and the page prominently features a video led by WineExpress’s well-known wine director.
Although the page already converted reasonably well, the team believed there was untapped potential. They faced a familiar challenge for e-commerce: how to optimize for conversions without sacrificing overall revenue—since higher conversions don’t always mean bigger basket sizes.
To tackle this, WineExpress partnered with WiderFunnel Marketing, who created and tested three page variations, mainly experimenting with layout and content placement. One redesigned version emerged as the clear winner:
- The wine-tasting video was moved above the fold, becoming the focal point of the page.
- The revised layout simplified the design and reduced distractions, guiding users more smoothly toward purchase.
The results were significant: revenue per visitor increased by 41%, and conversion rates rose as well. Importantly, the company proved that optimizing for the right metric—revenue per visitor rather than just conversion rate—drove more meaningful business growth.
Key Takeaways:
- Use A/B testing not just to improve conversions, but to maximize revenue per visitor or long-term customer value.
- Layout and eyeflow matter: strategically placing high-value content (like video) can significantly influence buying behavior.
- Success comes from balancing user experience with revenue optimization.
Note: The reference comes from Lean Analytics by Alistair Croll and Benjamin Yoskovitz. A classic example is WineExpress, which boosted revenue per visitor by 41% through A/B testing different product page layouts.
How WineExpress Increased Revenue by 41% per Visitor
The Challenge
- Highly trafficked “Wine of the Day” page already performing well
- Goal: Boost results without sacrificing average order value
- Balance needed: Conversion Rate vs. Revenue per Visitor
The Experiment
Partnered with WiderFunnel Marketing, and tested 3 different page layouts
- Key variation:
- Video moved above the fold
- Cleaner design with fewer distractions
- Improved eyeflow toward purchase
The Result
- +41% Revenue per Visitor
- Higher conversion rates
- Customers bought more wine per visit
Insights
- Optimize for revenue metrics (Revenue/Visitor, CLV), not just conversion rate
- Strategic content placement (like video above the fold) drives engagement
- A/B testing reveals hidden growth opportunities—even on already strong pages
Connecting A/B Testing to Pirate Metrics (AARRR)
Dave McClure’s Pirate Metrics (AARRR) framework—Acquisition, Activation, Retention, Revenue, Referral—offers a powerful way for SMEs to think about growth. Here’s how A/B testing directly supports each stage:
1. Acquisition – Attracting the Right Users
Goal: Increase website traffic, app downloads, and user sign-ups
Example Scenario: You run an online language learning platform and want to boost new user registrations.
- You A/B test two landing page headlines:
- Version A: “Learn English Now – Quickly Improve Your Speaking Skills”
- Version B: “Join Thousands of Learners and Learn English Easily”
- Result: Version B’s CTR is 20% higher, showing that this message resonates better with the target audience.
Key Metrics: Click-through rate (CTR), landing page conversion rate, cost per acquisition (CPA).
Through testing, you can see which messaging attracts users more effectively, making your traffic more qualified.
2. Activation – Creating Users a “Wow” Moment
Goal: Help users quickly experience value and increase the chance of continued use.
Example Scenario: In your language-learning web app, new users need to complete their first lesson after signing up.
- You A/B test two onboarding flows:
- Version A: Introduce 10 features in detail before starting the first lesson.
- Version B: Immediately guide users into the first interactive lesson, introducing features gradually afterward.
- Result: Version B saw 35% more users completing their first lesson. Users felt they gained value right away, making them more likely to stay.
Key Metrics: Sign-up completion rate, first core action (e.g., completing the first lesson, sending the first message).
3. Retention – Getting Users to Come Back
Goal: Improve return visits and reduce churn.
Example Scenario: Your web app sends daily learning reminders, but return rates are low.
- You A/B test two notification strategies:
- Version A: Send a reminder every day at 9 AM.
- Version B: Send reminders at personalized times based on user activity.
- Result: Version B increased retention by 15%. Personalized reminders proved more effective.
Key Metrics: Daily/weekly/monthly active users, churn rate, number of core actions.
4. Revenue – Increasing Monetization
Goal: Boost revenue contribution per user.
Example Scenario: Your platform offers a paid subscription plan, and you want to increase conversions.
- You A/B test two pricing page designs:
- Version A: Only list the plans and prices.
- Version B: Include user testimonials and course highlights alongside the prices.
- Result: Version B’s subscription conversion rate increased by 18%. Social proof and value presentation were key.
Key Metrics: Average revenue per user (ARPU), conversion rate, cart abandonment rate.
Note: The WineExpress case, which increased revenue per visitor by 41%, is a perfect example here.
5. Referral – Getting Users to Invite Others
Goal: Encourage users to recommend your product to friends.
Example Scenario: You launch a “Invite Friends to Learn Together” feature.
- You A/B test two reward types:
- Version A: Free course for successful referrals.
- Version B: Discount coupon for successful referrals.
- Result: Version A generated 25% more referrals per user compared to Version B. Free courses motivated users to share more.
Key Metrics: Referrals per user, referral conversion rate.
Key Takeaways
- The real strength of A/B testing lies in validating decisions with data, while AARRR helps you quantify goals.
- Every stage—Acquisition, Activation, Retention, Revenue, and Referral—can be tested, and each optimization can drive growth.
- Even small improvements in each step, when accumulated, can significantly boost overall performance.
- Start with high-impact hypotheses and keep iterating to build a product that sustains long-term growth.
By running A/B tests at each stage of AARRR, SMEs can methodically improve the customer journey and uncover high-leverage opportunities.
Why SMEs Can’t Ignore A/B Testing
Large enterprises can afford mistakes; SMEs often can’t. Here’s why testing is especially critical for smaller businesses:
- Limited traffic = higher stakes: Every visitor is precious. Testing ensures you’re not leaving conversions to chance.
- Faster learning = faster pivots: SMEs can adapt quickly. A/B testing provides evidence to make confident changes without prolonged debates.
- Resource efficiency: Instead of redesigning your whole website, test small elements—headlines, images, or CTAs—that can yield outsized impact.
Practical Steps to Start A/B Testing
1. Map Your Funnel & Set Clear Goals: Define the user journey for each AARRR stage. Test only one core KPI at a time, aligned with AARRR—for example, sign-ups (Activation) or checkout completion rate (Revenue).
2. Prioritize & Form Hypotheses: Start with the stages that have the biggest impact, and set clear goals and expected outcomes for each test. For example, data showed that users who used the “Recurring Investment” feature had higher retention. So we changed the button text from “Would you like to start a $10/week recurring investment?” to “If you invest $10 every week, your principal alone could grow to $2,600 in 5 years. Start investing $10/week today?” As a result, click-through rates increased by 40%.
3. Ensure a Sufficient Sample & Collect Data: Use free or open-source tools like GA4, PostHog, or Clarity. Even with low traffic, run the test long enough to ensure statistically meaningful results.
4. Keep Iterating: A/B testing isn’t a one-time project; it’s a continuous cycle of learning and optimization.
Closing Thoughts
As Lean Analytics reminds us, good data reduces uncertainty, whether it’s confirming a “known known” or uncovering an “unknown unknown.” When combined with frameworks like AARRR, analytics and A/B testing provide SMEs with a structured path to growth.
And the WineExpress story proves it: even a single well-designed experiment can dramatically increase revenue.
For SMEs, the message is clear: stop guessing, start testing. Your website can—and should—be your best-performing salesperson.